Introduction
I’m currently working on a few Data Visualization projects and am using WPF most of the time. Charting controls are very useful for the one related to statistics and data handling. WPF toolkit is free and open source, however is used by few because of its limited charting support. In my opinion, it is quite useful and straightforward to use.
Here, I’m just demonstrating the basic charting controls and setting data for display. For articles related to this in future, I shall demonstrate advanced features of WPF Toolkit.
Beginning
No prior knowledge of WPF is required. You just need to be aware of HTML (which I’m pretty sure everyone is, nowadays). XAML coding is pretty fun.
Firstly, I’ll mention the installation steps and then will dive into coding XAML and related C# files for visualizing static set of data.
First Step – Install WPF Toolkit
Install WPF Toolkit from this site:
(Please check the installation and usage instructions as mentioned here.)
Add new WPF application in Visual Studio.
If you are not able to view chart controls in Toolbox, right click Toolbox and select Choose Items. Then click on WPF components and select chart controls (the ones mentioned in the title). This will add the controls to your toolbox and you should be able to drag and drop them on the XAML form.
Second Step – XAML Coding for Charting Controls
XAML (Extensible Application Markup Language) is a markup language for declarative application programming. If you are interested in knowing more about XAML, please refer to the MSDN documentation at http://msdn.microsoft.com/en-us/library/ms747122.aspx.
As you can see in the following MainWindow.xaml code, there are a lot of
tags, each one refers to the 5 different charting controls that we are going to use.Collapse
Window x:Class="WpfToolkitChart.MainWindow" xmlns="http://schemas.microsoft.com/winfx/2006/xaml/presentation" xmlns:x="http://schemas.microsoft.com/winfx/2006/xaml" Title="MainWindow" Height="1031" Width="855" xmlns:chartingToolkit= "clr-namespace:System.Windows.Controls.DataVisualization.Charting; assembly=System.Windows.Controls.DataVisualization.Toolkit"> ScrollViewer HorizontalScrollBarVisibility="Auto" VerticalScrollBarVisibility="Auto" Margin="0,-28,0,28"> Grid Height="921"> chartingToolkit:Chart Height="262" HorizontalAlignment="Left" Margin="33,0,0,620" Name="columnChart" Title="Column Series Demo" VerticalAlignment="Bottom" Width="360"> chartingToolkit:ColumnSeries DependentValuePath="Value" IndependentValuePath="Key" ItemsSource="{Binding}" /> /chartingToolkit:Chart> chartingToolkit:Chart Name="pieChart" Title="Pie Series Demo" VerticalAlignment="Top" Margin="449,39,43,0" Height="262"> chartingToolkit:PieSeries DependentValuePath="Value" IndependentValuePath="Key" ItemsSource="{Binding}" IsSelectionEnabled="True" /> /chartingToolkit:Chart> chartingToolkit:Chart Name="areaChart" Title="Area Series Demo" VerticalAlignment="Top" Margin="33,330,440,0" Height="262"> chartingToolkit:AreaSeries DependentValuePath="Value" IndependentValuePath="Key" ItemsSource="{Binding}" IsSelectionEnabled="True"/> /chartingToolkit:Chart> chartingToolkit:Chart Name="barChart" Title="Bar Series Demo" VerticalAlignment="Top" Margin="449,330,43,0" Height="262"> chartingToolkit:BarSeries DependentValuePath="Value" IndependentValuePath="Key" ItemsSource="{Binding}" IsSelectionEnabled="True"/> /chartingToolkit:Chart> chartingToolkit:Chart Name="lineChart" Title="Line Series Demo" VerticalAlignment="Top" Margin="33,611,440,0" Height="254"> chartingToolkit:LineSeries DependentValuePath="Value" IndependentValuePath="Key" ItemsSource="{Binding}" IsSelectionEnabled="True"/> /chartingToolkit:Chart> /Grid> /ScrollViewer> /Window>Beginning with the
tag, you can see that there is an attribute that saysxmlns:chartingToolkitwhich is basically a namespace referring to the added WPF Toolkit.I’ve used
tag in order to add horizontal and vertical scrollbars to the XAML page.Now starting with first charting control,
columnChart, drag and drop the column series control in toolbox on XAML page and you will see a rectangle with nothing inside. Look in the XAML window (usually below the Designer), and you will see:Collapse
chartingToolkit:ColumnSeries DependentValuePath="Value" IndependentValuePath="Key" ItemsSource="{Binding}" />Now all the charting controls needs to be encapsulated in
(which is a good practice). It has different attributes such as height, horizontal alignment, name, title, width, etc. which are just concerned with the way in which it appears on the page.Our basic concern is understanding the attributes of
here and in all other charting controls. I’m using three attributes.DependentValuePathandIndependentValuePathare related to the Axis of the Chart (i.e. X-axis, Y-axis). “Value” and “Key” as assigned to them respectively - this is because I’m usingKeyValuePairdata type in my data model (which hasKeyandValue). You can also useDictionaryor any other data type by just making sure that you have two parameters that are interdependent for visualization.Itemsourceattribute is used for binding our data to the control.Follow the same as above for all the other controls as mentioned and now we shall assign the data model to the controls.
Third Step – Assigning Data Model to the Controls
As you can see in the MainWindow.xaml.cs file, it is pretty straightforward with the way we are assigning data model.
Collapse
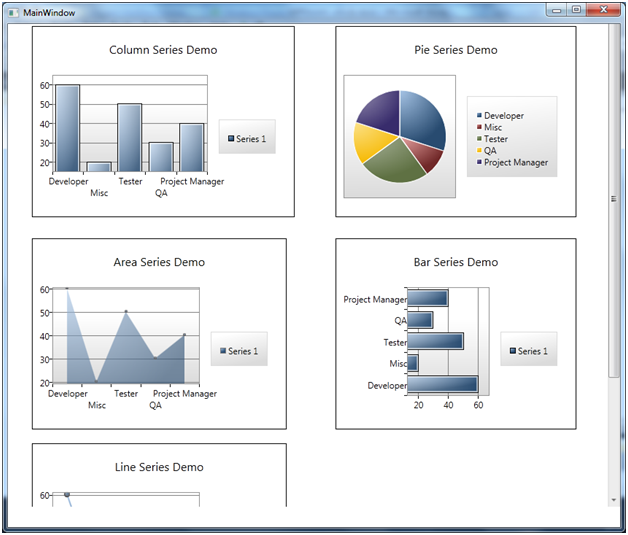
namespace WpfToolkitChart { /// summary> /// Interaction logic for MainWindow.xaml /// /summary> public partial class MainWindow : Window { public MainWindow() { InitializeComponent(); showColumnChart(); } private void showColumnChart() { List> valueList = new List>(); valueList.Add(new KeyValuePair("Developer",60)); valueList.Add(new KeyValuePair("Misc", 20)); valueList.Add(new KeyValuePair("Tester", 50)); valueList.Add(new KeyValuePair("QA", 30)); valueList.Add(new KeyValuePair("Project Manager", 40)); //Setting data for column chart columnChart.DataContext = valueList; // Setting data for pie chart pieChart.DataContext = valueList; //Setting data for area chart areaChart.DataContext = valueList; //Setting data for bar chart barChart.DataContext = valueList; //Setting data for line chart lineChart.DataContext = valueList; } } }I’m using
staticlist with 5 entries.DataContextis the property assigned to charting controls and you can assign the list directly to the controls and you are good to go.Fourth Step – Compile and Run
Compile and run and you should see the following:

Conclusion
I hope this article provides you with enough assistance to keep the work going on for visualizing information. Information Visualization is changing the way people look at data and in my view, it is going to play a key role in future.
I’ll explain advanced features related to assigning complex data model to controls in the future.
History
- 15th May, 2011: Initial post
License
This article, along with any associated source code and files, is licensed under The Code Project Open License (CPOL)
About the Author
Priyank Kabaria
United States
Member
Posted via email from 米良的实验室


没有评论:
发表评论